11 Tiger Global Salesforce Trades
The first Salesforce trade was made in Q4 2017. Since then Tiger Global bought shares five more times and sold shares on five occasions. The investor completely sold their stake between Q3 2020 and Q2 2022.
News about Salesforce Inc and Tiger Global
Salesforce.Com Inc and Tesla Inc at Milken Institute Global Conference (Virtual) Transcript
Salesforce.Com Inc and Tesla Inc at Milken Institute Global Conference (Virtual) Transcript

Reinstate Sam Altman, Investors Pressurize OpenAI Board
The post Reinstate Sam Altman, Investors Pressurize OpenAI Board appeared on BitcoinEthereumNews.com . After all the drama that unfolded this Friday with the...
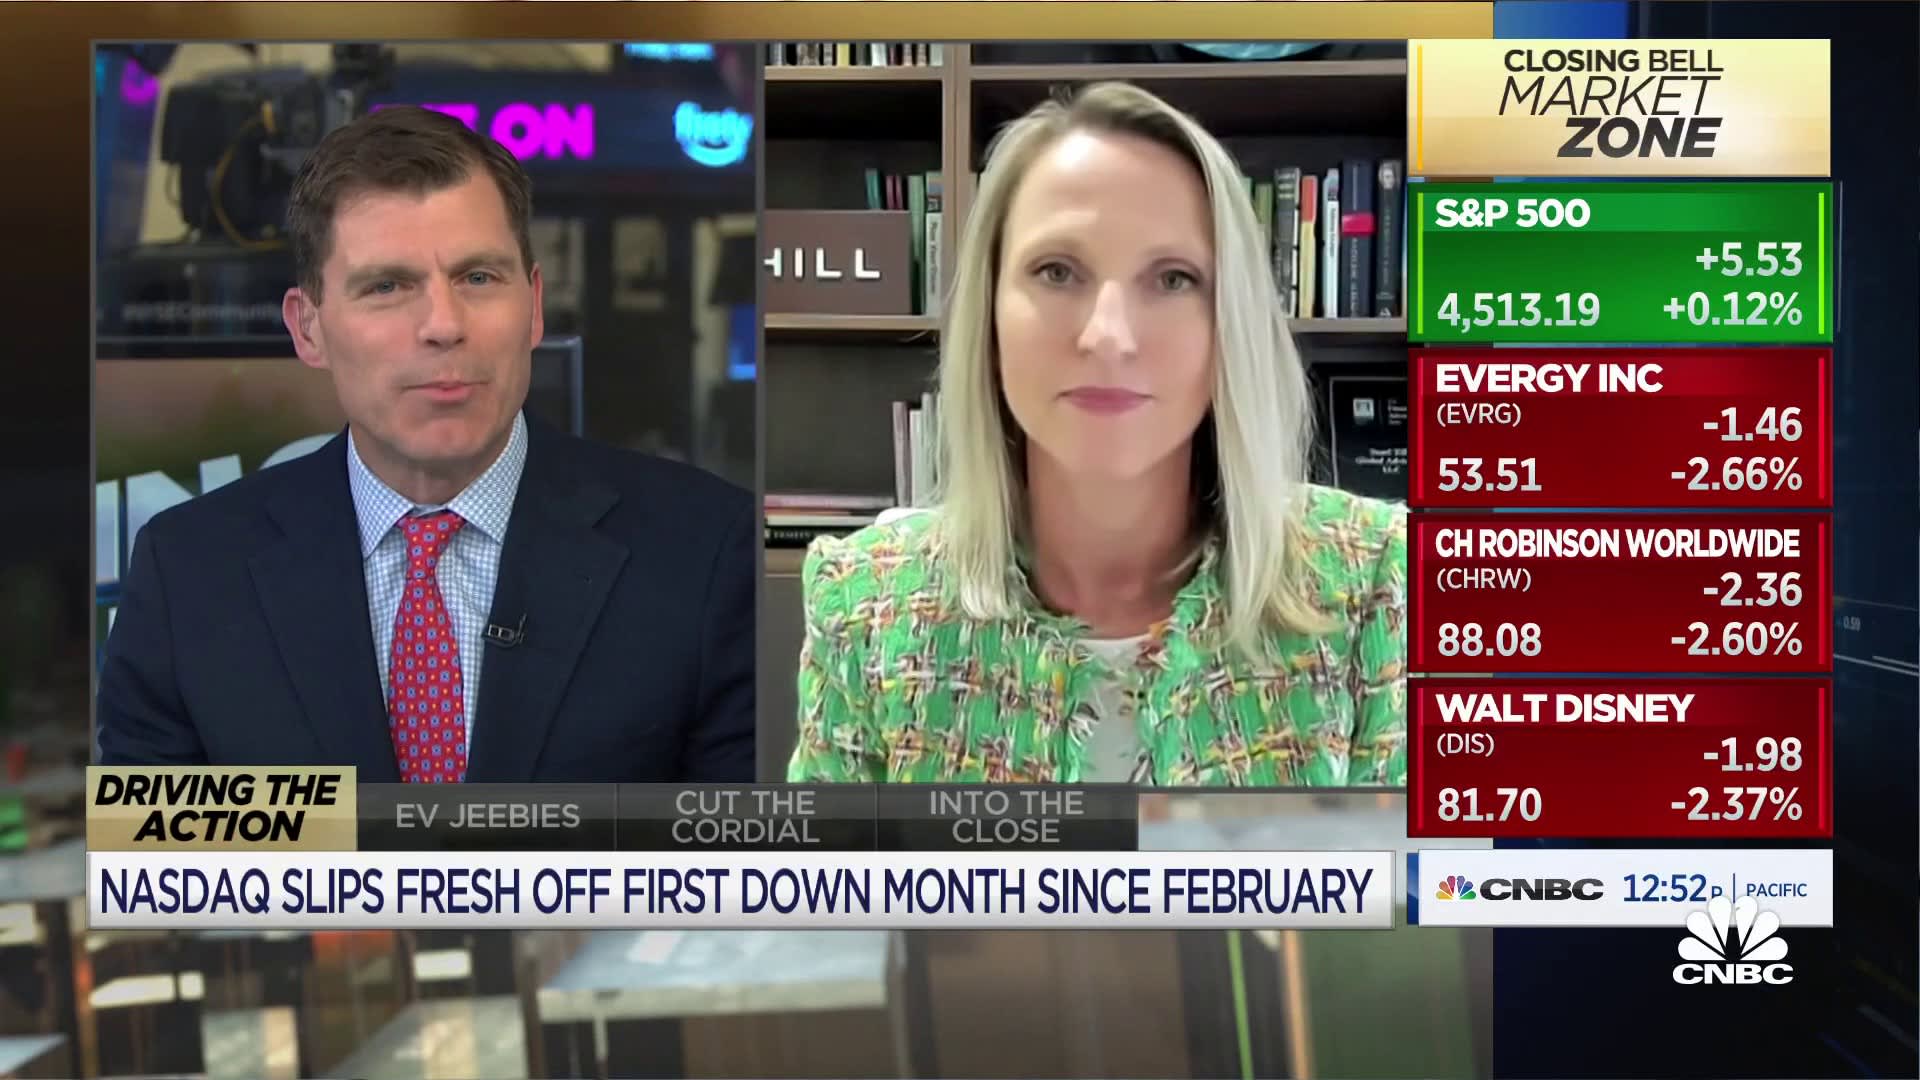
Sandhill''s Brenda Vingiello names Salesforce, Google and Amazon as companies with further upside
Brenda Vingiello, Sandhill Global Advisors, joins ''Closing Bell'' to discuss the tech sector and trading day.

Anthropic to Receive Additional $100M From South Korea’s SK Telecom
SK Telecom , the largest telco in South Korea, announced an additional investment of $100 million in Anthropic, a San Francisco-based artificial intelligence...