14 Tiger Global Qualcomm Trades
The first Qualcomm trade was made in Q4 2006. Since then Tiger Global bought shares six more times and sold shares on seven occasions. The investor sold all their shares in Q3 2013 and doesn't own any shares in Qualcomm anymore.
News about Qualcomm, Inc. and Tiger Global

Paramount Global, Qualcomm, Luckin Coffee, New York Community Bancorp, Tesla: Why These 5 Stocks Are On Investors'' Radars Today
Major U.S. indices flashed red on Wednesday after the Federal Reserve maintained interest rates between 5.25% and 5.5%. The Dow Jones Industrial Average clos...
Brandywine Global Investment Management LLC Cuts Stock Position in QUALCOMM Incorporated (NASDAQ:QCOM)
… Commission (SEC). The institutional investor owned 639,604 shares … last quarter. Moneta Group Investment Advisors LLC increased its … funds and other inst...

Globalstar Satellites Enter New Era With Qualcomm''s Ex-CEO Paul Jacobs at Helm
Moves in the satellite company''s share price point to hope among investors that it could be poised for better times after years of struggling to turn a profit.
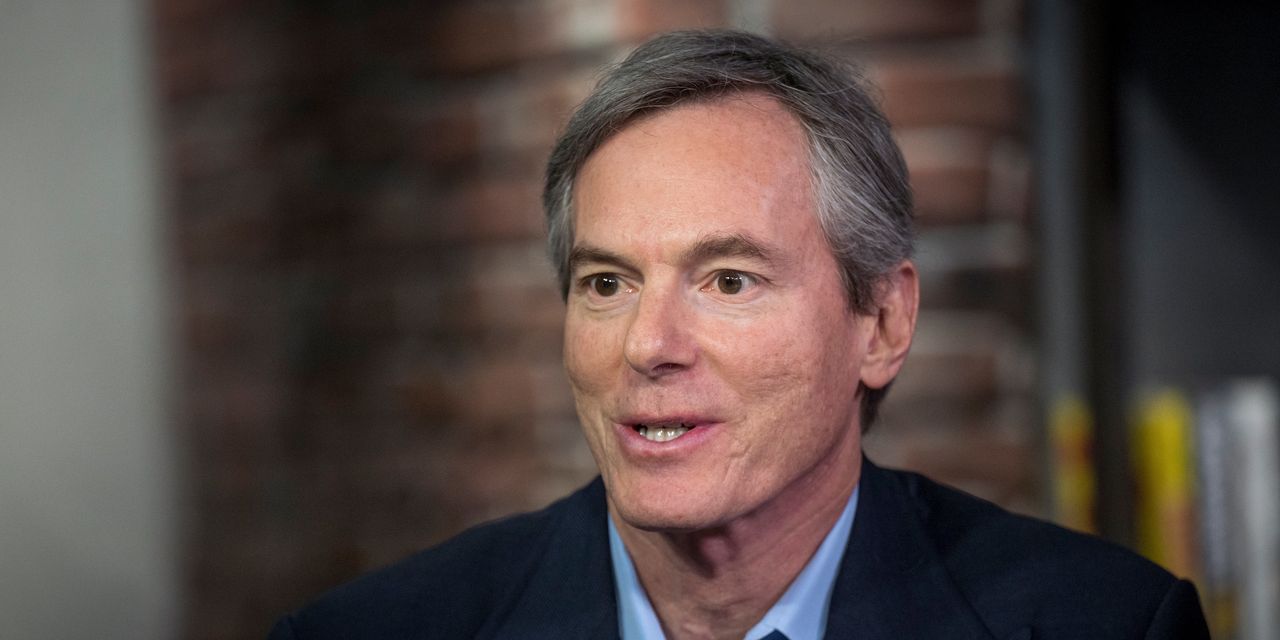
Former Qualcomm boss Paul Jacobsis taking over as chief executive of Globalstar, a satellite company that supports Apple''s emergency-communications capabilities.
Former Qualcomm boss Paul Jacobs is taking over as chief executive of Globalstar, a satellite company that supports Apple’s emergency-communications capabili...