27 Tiger Global Alibaba Group Holding Ltd - ADR Trades
The first Alibaba Group Holding Ltd - ADR trade was made in Q4 2014. Since then Tiger Global bought shares eleven more times and sold shares on fifteen occasions. The investor sold all their shares in Q4 2023 and doesn't own any shares in Alibaba Group Holding Ltd - ADR anymore.
News about Alibaba Group Holding Ltd - ADR and Tiger Global
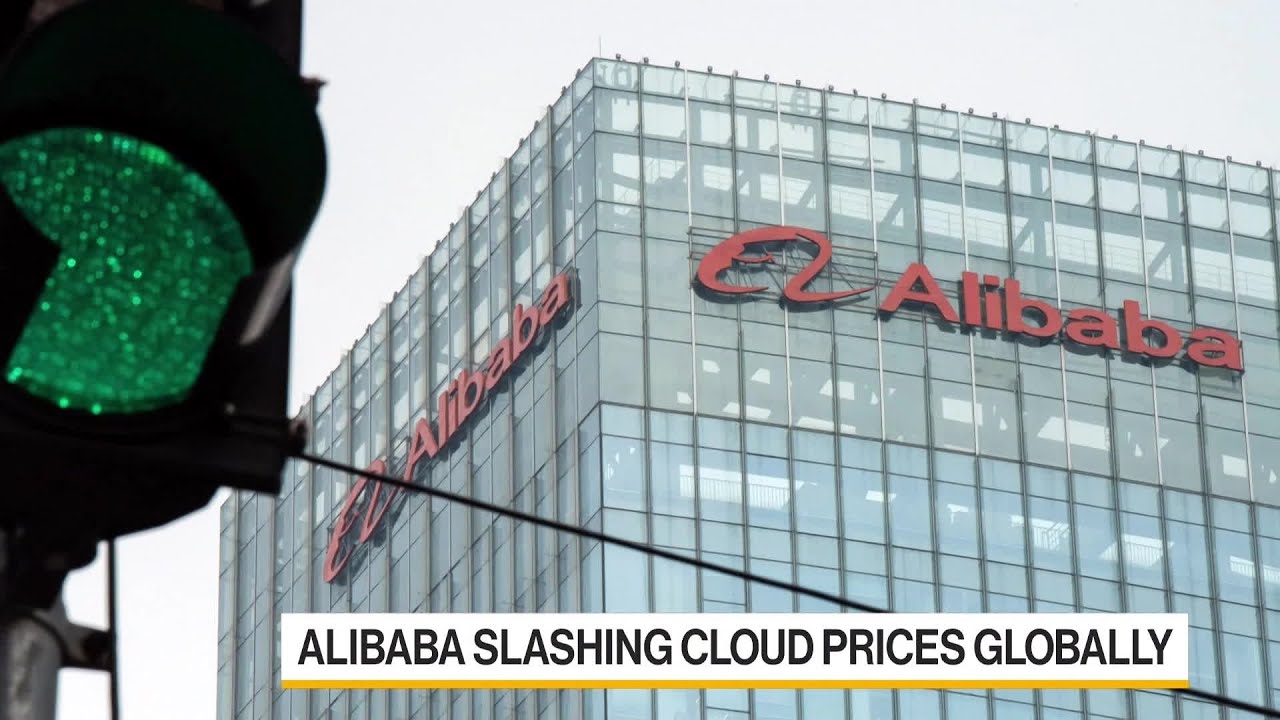
Alibaba Cuts Cloud Prices Globally as AI Demand Quickens
Alibaba Cuts Cloud Prices Globally as AI Demand Quickens Alibaba Group Holding Ltd. is cutting prices for cloud customers outside of China by as much as 59%....

Alibaba News Roundup: Chinese Hospitals Deploy DAMO Academy Cancer Screening Tool; Alibaba Cloud Cuts Prices; Global Program Supports Over 4,000 Entrepreneurs
A cancer screening tool developed by Alibaba Group’s research arm DAMO Academy recently launched at hospitals in China, making it faster and more cost-effect...

Alibaba.com Reveals Growing Global Demand for Smart Fitness and Sustainable Sport Products
B2B buyers purchase new, innovative products items ahead of anticipated January demand for fitness products LONDON, Dec. 18, 2023 /PRNewswire/ -- Alibaba.com...
Investing News — China’s Alibaba Goes For Turkey’s Global E-Exports Market
China’s Alibaba (Taobao) and Turkey’s Trendyol have agreed to a $2 billion investment from the Chinese hi-tech and e-commerce mammoth. The… Continue reading ...